Espero sea suficiente, gracias por responder...
Código:
// Create the graph. These two calls are always required
$graph = new Graph(400,200,"auto");
$graph->SetScale("textlin");
$graph->img->SetAntiAliasing();
$graph->xgrid->Show();

$graph->xgrid->SetLineStyle("solid");
$graph->xaxis->SetTickLabels(array($meses));

// Create the linear plot
$lineplot=new LinePlot($ydata);
$lineplot->SetColor("black");
$lineplot->SetWeight(2);
$lineplot->SetLegend($ana["detalle"]);

// Setup margin and titles
$graph->img->SetMargin(40,20,20,40);
$graph->title->Set("Media");
$graph->xaxis->title->Set("Meses");
$graph->yaxis->title->Set("Media");
$graph->ygrid->SetFill(true,'#[email protected]','#[email protected]');

// Add the plot to the graph
$graph->Add($lineplot);

// Display the graph
$graph->Stroke();
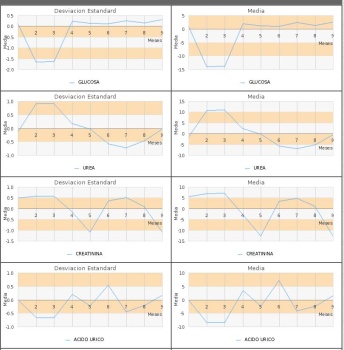
En la imagen de ejemplo se muestran varios ejemplos como verán el 0 (cero) se va cambiando de posición, los labels o etiquetas acompañan a la línea cero y se van moviendo. En los ángulos de las líneas donde corresponderían los valores debería situarse el valor.